Luke Surl Comics
The latest from LukeSurl.com
@lukesurl on Twitter
- Today's comic completes my chess trilogy with 'Breaking Pawn' :
http://t.co/vUA6wUI52012/04/17 - #SCIENCEFACT It's IMPOSSIBLE for a person to pat their head and rub their stomach at the same time! If you can do this - you're a robot!2012/04/17
- Does anyone else subscribe to "Deceleration Monthly"? It's the best for braking news.2012/04/16
- Today's comic is about chess. Why not give it a ROOK?
http://t.co/9nUaRDDj2012/04/15 - My latest piece of merchandise. I'm shamelessly selling out to what the public demands:
http://t.co/Zr2EmTlz2012/04/14
Tag cloud
Twitter
Medical
Love
murder
Economy
Drugs
Film
Literature
Poetry
Maths
Pop Music
Christmas
Wizard of Oz
music
Nursery Rhymes
chemistry
Shakespeare
Religion
songs
Superman
Politics
Grammar
Police
Internet
Superheroes
Death
Evolution
Vampires
Heart
Math
star trek
Hamlet
Zombies
Psychiatrist
Animals
Fish
Space
Musicals
time travel
Video Games
Mathematics
Chess
CCTV
sea
Art
Facebook
Science
Health
crime
physics
Mythology
Rock
Ocean
Magic
Cavemen
philosophy
Computers
Court
Pirates
Graphs
©2008-2012 Luke Surl | Powered by WordPress with ComicPress | Subscribe: RSS | Back to Top ↑


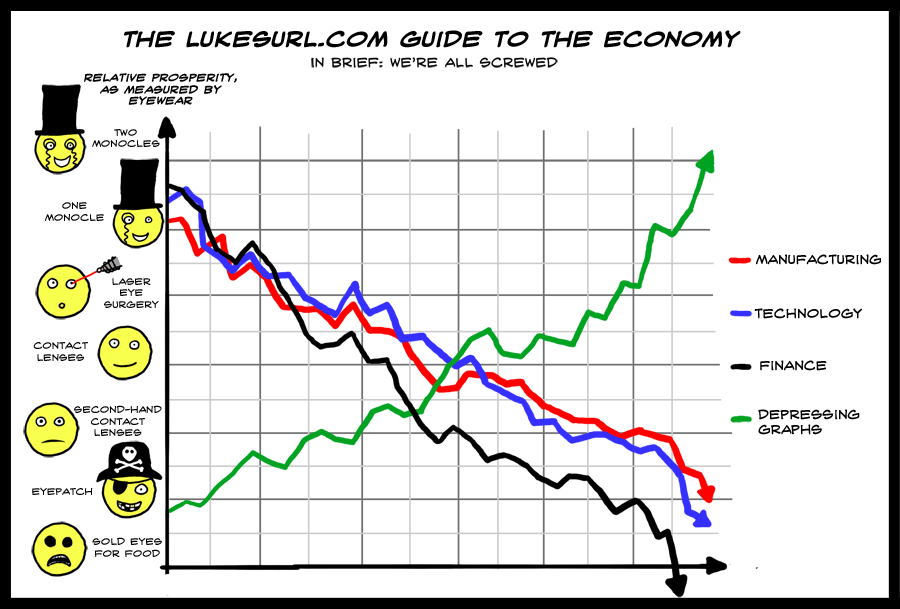
Two monocles… hilarious!
haha! - I love your y-axis.
This is my favorite of all of them XD
sold eyes for food =D hehehe
For a second, I thought this graph was showing a raising rate in pirating.
Funny on so many levels. And I can’t believe that you out ‘second-hand contact lenses’ in there!
I’d like 2 monocles.
You need to label your X-Axis. I don’t get it.
Actually, you should place the ‘relative prosperity’ along the X-axis from double monocle to missing eyes, then put ‘absolute awesomeness of’ along the y-axis.
y is everyones economy bad? how does that work?
Heh, the ‘depressing graphs’ bit reminds me of a sign business mentioned in the Michael Moore movie, which was able to buck the depr-err, recession, due entirely to all of the foreclosure signs they were making.
What is the horizontal axis?
Value of stocks in
Shame on you! Label your axes, young man!